Design a Crochet Graph from a Visual Reference →
Start with a blank grid, define stitch or block units and build a motif with labels and row notes.
 MotifDraft
Your pattern, your pace
Create a crochet graph online from a blank grid or image. Customize colors, cell proportions and row notes, then print your chart. Start free.
Blank-first color grid · Stitch or block labels · Custom palette, cell proportions and row notes
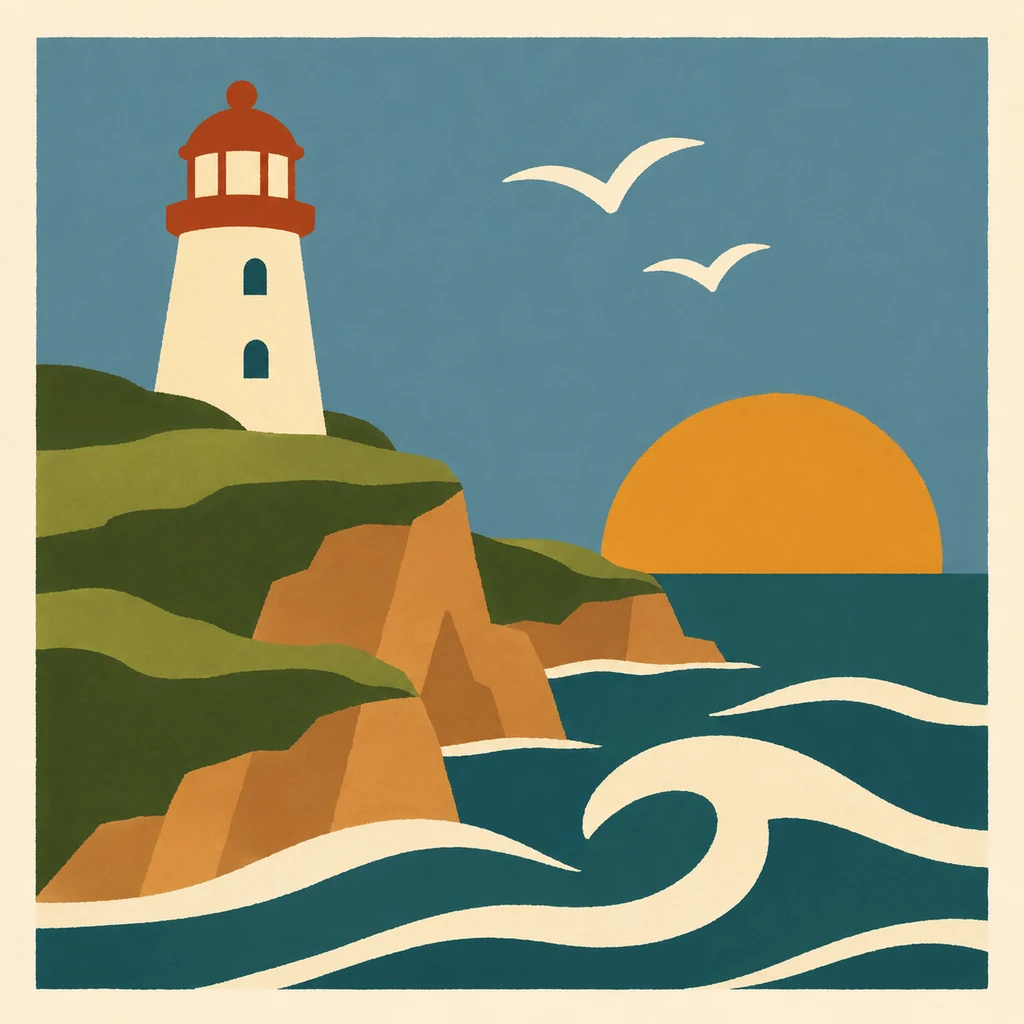
Originals, made for making
Follow each design from original artwork to an editable chart and an illustrated craft finish. Open the chart to adjust colors, edit cells and print your own version.
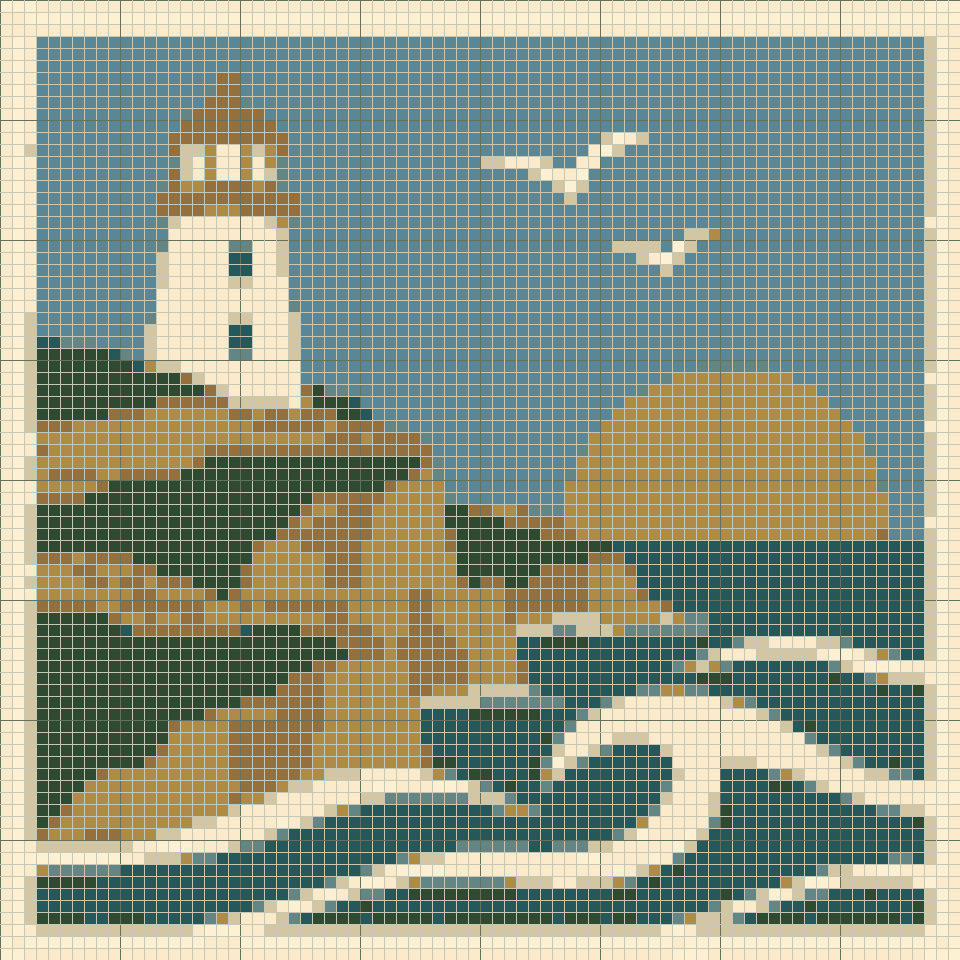
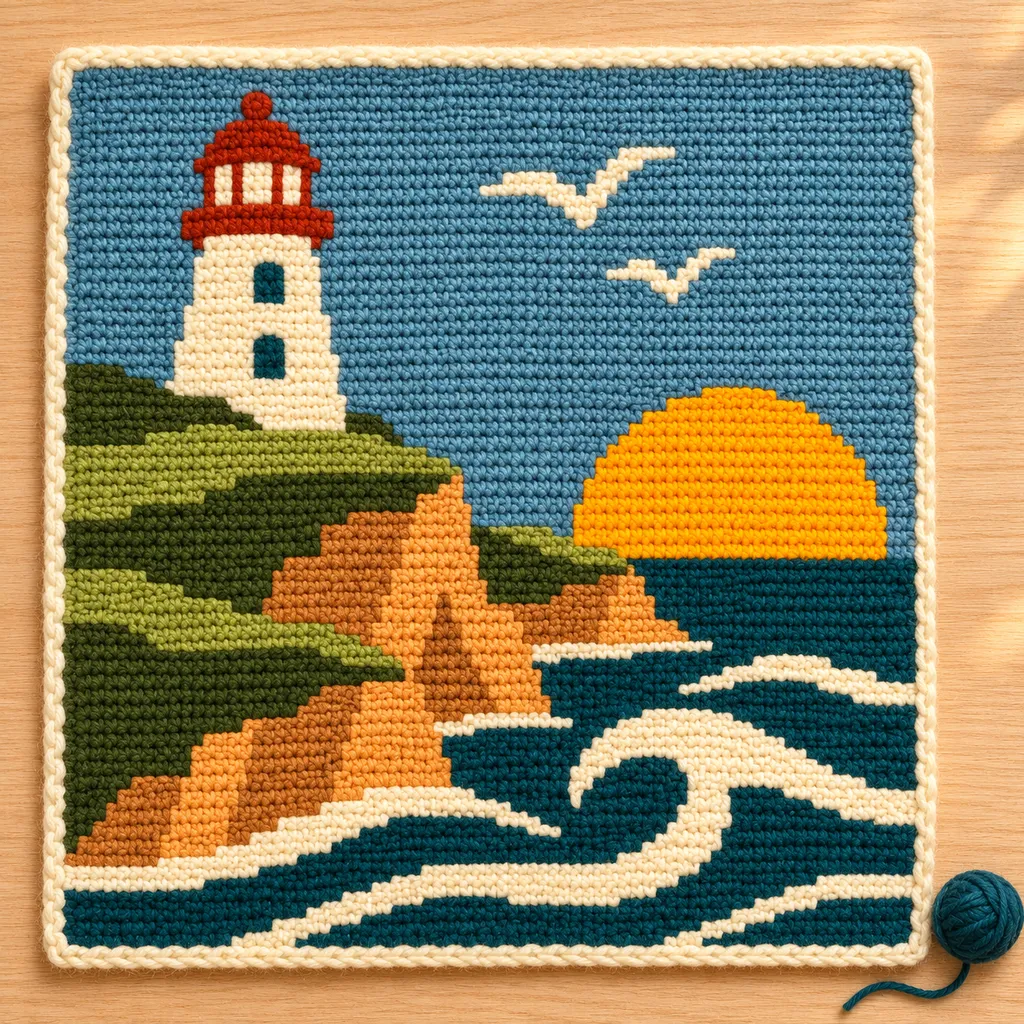
AI mockups illustrate a possible finish, not an exact rendering of the chart. The editable chart is actual tool output; physical making has not been tested.
Choose a stitch grid or a block grid. One cell is one unit of the selected type, but the tool does not decide how to work that unit. Use the specialized tapestry or filet maker for their technique-specific conventions.
Start with a blank graph (8–160 columns and rows on Free, up to 400 with Maker Plus), choose the cell height-to-width ratio and draw a motif. This workflow is designed for manual graph planning; image import is available as an optional starting point.
Rename custom colors, adjust their reference hex values and mark selected rows with short notes. Row notes are saved in the project and printed with the row guide. Flat mode alternates reading direction; same-direction rounds do not.
Save the editable JSON project and print a legend, numbered chart sections, color-run rows and your row notes. Printing uses square reference cells for readability; your chosen preview ratio is recorded in the cover.
Use Tapestry Crochet for a single-crochet swatch gauge and finished-size estimate. Use Filet Crochet for open/filled meshes and its explicit 4-dc convention. This general graph does not generate a complete garment or stitch-symbol diagram.
Add a name or short phrase with block lettering, preview its size and place it as editable cells. My projects keeps separate charts, notes, print settings and completed rows in this browser. Save a copy for a variation, or archive and restore older work.
Keep an editable JSON backup, choose A4 or Letter for PDF printing, download a PNG overview or export material counts as CSV. Make mode tracks completed rows; this browser also keeps one automatic draft per maker.
Start with a blank grid, define stitch or block units and build a motif with labels and row notes.
Use selection and canvas controls carefully, then preserve a clear legend and working notes for your graph.
Preview block lettering, fit it to your chart and preserve the result in any of the five makers.
Save local or cloud projects, keep editable backups and resume row progress across all five makers.
Pick the right export, match paper settings and review page boundaries before making your project.
Build a blank-first graph with custom color labels, cell proportions and saved row notes.
Yes. Free includes local conversion and editing up to 160 × 160, plus PNG, CSV, JSON and basic PDF printing without an account. Maker Plus supports up to 400 × 400. Cloud saving requires sign-in; Free accounts can save 5 cloud projects.
Try a sample first, then use a small grid and a few colors. Review individual cells and print a test page before starting a large project.
Start with a blank graph (8–160 columns and rows on Free, up to 400 with Maker Plus), choose the cell height-to-width ratio and draw a motif. This workflow is designed for manual graph planning; image import is available as an optional starting point.
Yes. Draw a motif or import an image and decide whether each cell means a stitch or a block. For single-crochet colorwork with measured gauge, use the Tapestry maker. The graph does not generate blanket construction or diagonal C2C instructions.
Yes. Set width and height from 8 to 160 on Free, or up to 400 with Maker Plus. These settings apply to the next generated or blank chart. Use Resize existing canvas to add space or crop an existing design without resampling it.
Yes. Create or edit your chart, open Export settings, choose A4 or Letter, then use Print / Save PDF. Select Save as PDF in your browser’s print dialog. Check the saved file; canceling the dialog creates no PDF.
Yes. Local drafts and downloaded JSON preserve your chart and row progress. Sign in and choose Save to cloud to continue on another device, then save changes explicitly. Signing in does not upload local projects automatically. Keep a separate JSON backup.
The graph workspace starts with a blank design, supports stitch or block labels, freely adjustable cell proportions and saved row notes. Tapestry uses a measured single-crochet swatch.
No. This tool creates grid-based charts, not free-form crochet symbol diagrams.
Only when you select stitch units and your technique uses that convention. Block mode deliberately labels each cell as a block; no block construction is generated.
Yes. In Design mode, select a row, enter a note and choose Save row note. Notes are included in project files and the printed row guide. Make mode tracks completed rows separately. Cloud projects require sign-in and an explicit save; local edits are not automatically synchronized.